May 21, 2014 / by Torsten Bøgh Köster / CTO / @tboeghk
Tomcat log management with Logstash and Graylog2
Collecting and parsing access logs from web servers like Nginx or Apache is widely covered. But when it comes to Apache Tomcat, even writing access logs can be tricky, parsing those in Logstash close to hell.
We run our Java applications on the fabulous Apache Tomcat server either behind an Nginx, HAProxy or a Varnish. To reflect a 100% view of your traffic, we collect most access logs at the entry point into our datacenter. Sometimes it may be desireable to collect Tomcat access and application logs.
Tomcat access logs
There’s no need to reinvent the wheel to configure Tomcat to produce decent access and application logs.
If your Tomcat runs behind a reverse proxy, the RemoteIpValve
comes in handy to replace the loadbalancers ip with the real client ip. Add it to your Tomcat server.xml.
<Valve className="org.apache.catalina.valves.RemoteIpValve"
  protocolHeader="x-forwarded-proto"
  remoteIpHeader="x-forwarded-for"
  requestAttributesEnabled="true" />
The AccessLogValve produces a access log in apache
combined format + some extras attached. It appends the request duration (%D) the current session identifier (%S) and the
Location header sent to the log message. Place it in your server.xml as well:
<Valve className="org.apache.catalina.valves.AccessLogValve"
  directory="logs"  prefix="access" suffix=".log"
  rotatable="false" resolveHosts="false"
  requestAttributesEnabled="true"
  conditionUnless="ignore-access-log" encoding="utf-8"
  pattern='%h %l %u %t "%r" %s %b "%{Referer}i" "%{User-agent}i" %D "%S" "%{Location}o"' />
We usually have log rotation disabled as we have a logrotate daemon rotating all the logfiles, that’s why we switch rotatable
to false. Check logs how to enable logfile rotation.
Tomcat application logs
The easiest way to collect log data from your favorite logging framework (log4j, slf4j, juli) is to format them easy
to parse and read – in JSON. We use slf4j on top of log4j. Place the logstash log4j JAR either in your WEB-INF/lib or
Tomcat /lib directory.
Logstash provides a JSONEventLayoutV1 as a log4j layout implementation.
Configure your FileAppender
(or RollingFileAppender) to use it:
<appender name="stdout-json" class="org.apache.log4j.FileAppender">
  <param name="Threshold" value="WARN" />
  <param name="File" value="${catalina.base}/logs/catalina.json.out" />
  <param name="Append" value="true" />
  <layout class="net.logstash.log4j.JSONEventLayoutV1" />
</appender>
The JSONEventLayoutV1 marshalls all logging event details in JSON, even the NDC
and MDC contents. Be aware that JSON logfiles get rather
big and needs some proper rotating. Use the logrotate daemon or use a RollingFileAppender above.
Mining data in Logstash
We use a centralized Logstash architecture and have Logstash shippers running on each machine, collecting logfiles and shipping them to a central Redis server. The Logstash supercharger collects log entries off Redis and processes them. In the end logs are sent to a Graylog2 instance. Here are some useful filters.
Parsing the log message
Grok ist the tool of choice when it comes to parsing logfiles. The following expression parses the access log created above:
grok {
  match => { "message" => "%{COMBINEDAPACHELOG} %{NUMBER:http_request_duration_ms} %{QS:http_session_id} %{QS:http_response_location}" }
  add_tag  => [ "combined_apache_log", "extended_tomcat_log" ]
}
N.B.: We use tagging a lot for debugging purposes.
Synching log message date
The Redis buffers messages between the Logstash shippers and the central supercharger. On service interruption, it’s important to restore the original log message date. Beware that you set your timezone correctly.
date {
  locale => "en"
  timezone => "Europe/Berlin"
  match => [ "timestamp", "dd/MMM/yyyy:HH:mm:ss Z" ]
  add_tag => [ "timestamped" ]
}
Geolocation
Logstash ships with the Maxmind Geolite database, which is pretty accurate.
geoip {
  source   => "clientip"
  fields   => [ "city_name", "country_code2", "country_name", "location", "real_region_name", "postal_code" ]
  add_tag  => [ "geoip" ]
}
Useragent & bot detection
The useragent filter ist based on the uaparser:
useragent {
  source    => "agent"
  prefix    => "useragent_"
  add_tag   => [ "useragent" ]
}
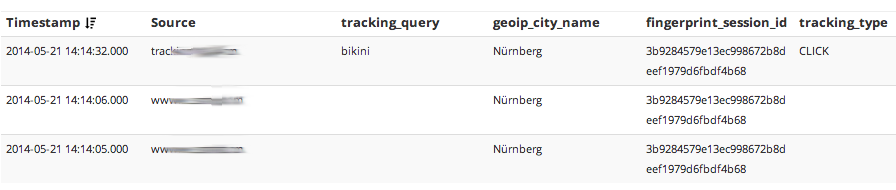
Fingerprinting
We fingerprint the clientip in combination with the useragent.
fingerprint {
  source => [ "clientip", "agent" ]
  concatenate_sources => true
  method => "SHA1"
  key => "somecrazyseed"
  target => "fingerprint_session_id"
  add_tag => [ "fingerprint" ]
}
For compliance reasons, you should either remove the clientip or hash it before sending the log message off to Graylog2.
Serve in Graylog2
Use the gelf output to send your messages to your Graylog2 instance. Enjoy in-depth analytics of your log messages and some serious cross-domain session tracking.